Cloud Performance Testing
Cloud Performance Testing: Generation 2
Superb Internet ThunderCloud™ versus Various Cloud Hosting Providers
At Superb Internet Technologies Inc., not only are we one of the world’s oldest web hosts (in business since 1996), but we are also the world’s most experienced virtualized hosting expert, as we were the very first to offer Virtual Private Server (VPS) – the predecessor to today’s cloud - commercial hosting in 1999. In short, we’ve been doing cloud hosting for more than 20 years, including for nearly a decade before the term was even coined. Being a recognized and well known innovator and leader in the industry - always staying true to our motto, “Ahead of the Rest”® - meant we set a very high standard to meet when it came to the Superb Cloud, which was designed as a true decentralized, 100% uptime platform from day 1: equal or better performance and functionality to dedicated servers, practically limitless real-time scalability, no bottlenecks or any centralized dependencies, and, of course, true 100% uptime.
After nearly 10 years of development, our Superb Cloud platform was released in 2013. (Yes, it took much longer than we would have liked. But, we were determined to provide a true 100% uptime, better-than-dedicated-in-every-way cloud.)
This report provides a top-level overview of some of the easier to portray performance tests and explains the results of the extensive, ongoing comparative performance testing that we have conducted of our and our competitors’ cloud VMs. In order to ensure that we always remain “Ahead of the Rest”® when it comes to cloud performance and value, and provide our customers with an “apples to apples” comparison, we are using a number of accounts with competing Cloud Hosting Providers (CHPs) and a DC2S-2188 account on the Superb Cloud, on which we run, either hourly or continuously, a series of standardized and well recognized performance tests. All accounts – with us and competing HSPs – are standard auto-provisioned customer accounts, the very same as anyone would purchase online. We’ve made no changes in order to improve or degrade the performance results of any of our tests.
In this report, we present illustrative data compiled over a 7-day period. We leave the decision and ultimate interpretation of the results and what it means - to you, our valued and respected customers and/or prospective customers.
ThunderCloud™ (Gen. 2) vs. TransparentCloud™ (Gen. 1)
Better, stronger, faster, and bigger VM sizes, than anyone else’s cloud. That was the goal behind the ThunderCloud, our Generation 2 cloud platform. We are pleased to say that we have met or exceeded our goals throughout. After two years of focused R&D, the ThunderCloud launched in 2017 and literally blew away the competition, offering not only practically limitless horizontal scalability, but also the largest vertical (VM size) scaling capacity, alongside truly unprecedented performance levels, true 100% uptime and unique infinitely flexible resource pool basis. We are not stopping there; soon-to-come Gen 2.1 will offer even more horizontal scalability, as part of our commitment to remain “Ahead of the Rest” ® and continue to provide to our clients the world’s most scalable (horizontally and vertically) public cloud. In short, we took the best available high-performance enterprise hardware, along with the fastest RAM, and the highest performing solid state storage, and spent many months testing & optimizing the performance, not resting on our laurels until we were certain that the ThunderCloud outperforms all the competition, while also adding even more redundancy and acceleration layers to the underlying Superb Cloud platform.
Cloud Hosting Comparison Basis
The table below illustrates the accounts that are used in the testing. We have matched up comparable features as much as possible; however, as you can see, there are some differences in the configuration – and even more so in price, due to the lack of standardization in cloud hosting services
| Provider | Superb Internet | Microsoft Azure | IBM/softlayer | Amazon Web Services | |
|---|---|---|---|---|---|
| Account Type | DC2S-2188 | F16 | DC 16 | N1-HIGHCPU-32 | c4.4XLARGE |
| GB RAM | 16GB | 32GB | 16GB | 14.4GB | 30GB |
| CPU Performance (Passmark) | 2188 | undisclosed (variable)* | undisclosed (variable)* | undisclosed (variable)* | undisclosed (variable)* |
| Number of Cores | 14 | 16 | 16 | 16 | 16 |
| SSD disk space | 220GB | 256GB | 100GB | 375GB | 320GB |
| Included Traffic | 10TB/month | None** | None** | None** | None** |
| Price | $275 per month all included | $496 per month with no Internet connectivity -or- $1988 per month with comparable 10TB/m |
$384 per month with no Internet connectivity -or- $1046 per month with comparable 10TB/m |
$662 per month with no Internet connectivity -or- $1220 per month with comparable 10TB/m |
$582 per month with no Internet connectivity -or- $1653 per month with comparable 10TB/m |
Note: Pricing is current as of August 1, 2018
* The great level of obfuscation in the Cloud Hosting industry is very worrying to us – and should be to you, as a cloud hosting consumer. With others, you never know what performance you are going to get: there are no commitments to how much of the CPU processing power you will get (as total or in each core). The reason for that is simple: practically all CHPs engage in [sometimes staggering levels of] overselling, so each core is sold many times over and over to multiple customers, on the assumption that most customers will not be using most of their processing resources most of the time. However, if just some of your “neighbors” happen to be using their allocated resources at the time when you need to use your cloud VM(s), your performance is likely to suffer considerably. Also, your performance can vary significantly simply based on your luck and depending on what hardware your account is provisioned. With us, however, each client is guaranteed, non-oversubscribed/non-oversold CPU resources, clearly stated in the widely accepted passmark standard. The performance is standardized over different hardware, to ensure that each cloud account is always equal performance, no matter where and how it is provisioned. Therefore, with us the CPU performance will never dip below the guaranteed level, as it is, as part of the basis of the cloud platform, guaranteed to each customer and never oversubscribed.
** As you will notice, while we include Internet connectivity and 10TB/month of traffic, others’ cloud price doesn’t include any Internet connectivity and all data transfer will be charged additional. That is just a small sample of the many “gotchas” that are, unfortunately, rampantly common in the cloud hosting industry: hidden fees left and right, so that while the headline price seems low, in the end the customer will end up paying unexpectedly more, making it very difficult to budget and plan ahead for the costs. We do not subscribe to that mindset, however, and believe in full and complete transparency and providing a simple, budget-friendly fixed price that 99%+ of customers will not exceed, thus avoiding the unpleasant surprise of a higher-than-expected invoice for services, as will be almost always the case with most other CHPs.
Testing Methodology
Our goal: Real world tests – real world results. Plain and simple.
Our testing team have used universally accepted and acknowledged open source or third party performance testing applications and tools. We then briefly explain what each test measures, and what it means, using real life examples. We installed a standard CentOS 6.7 64-bit image and then started running our tests. Our tests have been run continuously on an hourly basis, creating a log of the results of each tested cloud VM. Our goal with these tests is to provide you with information to allow you to make your own informed decision based on the results and your unique needs of cloud hosting. If you would like the specific tests results or to discuss this more in depth with us, we’ll be happy to provide it to you and to talk to you further. You are welcome to contact us anytime.
Disk I/O
If you remember those three and a half inch floppy disks you used as coasters for your morning coffee, or how well they flew across the room when you threw them just right – if you remember those, then you’ll know all about Disk IO bottlenecks.
Disk I/O encompasses the input/output operations on a physical disk. If you are reading data from a file on a disk, the processor needs to wait for the file to be read (the same goes for writing).
The killer when working with a disk? Access time. This is the time required for a computer to process a data request from the processor and then retrieve the required data from the storage device. Since hard disks are mechanical, you needed to wait for the disk to rotate to the required disk sector. So is no longer the case with our Generation 2 ThunderCloud; mechanical hard disks have went the way of the floppy disk and ThunderCloud is 100% Solid State Storage based, meaning that all your data is stored in memory and is practically instantly accessible, with no moving pieces to slow down read or write.
At Superb Internet we take Disk I/O seriously. We could have taken the easy way out and built large storage filers on a SAN network, but why use centralized storage, which is a relic of the mainframe era of several decades ago? (That doesn’t prevent most other HSPs from using obsolete technology, however. We think that it’s a bit funny how others’ “cloud” is mainframe-like, with all client data stored on a central storage array, which is also a single point of failure in any cloud; only the processing is distributed.) We have always lead the industry as an innovator; we like the latest (but stable) technology and speed, so we built our cloud using modern Distributed Storage technology, with underlying InfiniBand® 40Gb/s packet-loss and jitter free networking (typically only used in extremely high performance supercomputing applications, until now almost never used in consumer or business level computing). With us, all your data is always right where the processing is happening: available at local SSD read/write speeds, while benefitting from block-level modern distributed (non-centralized) storage, thus giving complete High Availability and Fault Tolerance.
We could have built our cloud with centralized storage (SAN) like the others, thus saving considerably on our cloud infrastructure costs, but the red line in the graphs below would have been lower. The result of being 100% Solid State Storage based (completely moving-parts legacy hard disk free) and using modern block-level Distributed Storage technology, which keeps multiple copies of all data, is local high-grade SSD I/O level performance (same as you would get on a top-of-the-line dedicated server) without any bottlenecks or any single points of failure, and with full real-time High Availability. Our investment in modern Distributed Storage technology and InfiniBand®, alongside being 100% SSD-based, clearly provides the best performance, hands down.
Here’s the test command we ran:
$ dd if=/dev/zero of=sb-io-test bs=1M count=1k conv=fdatasync
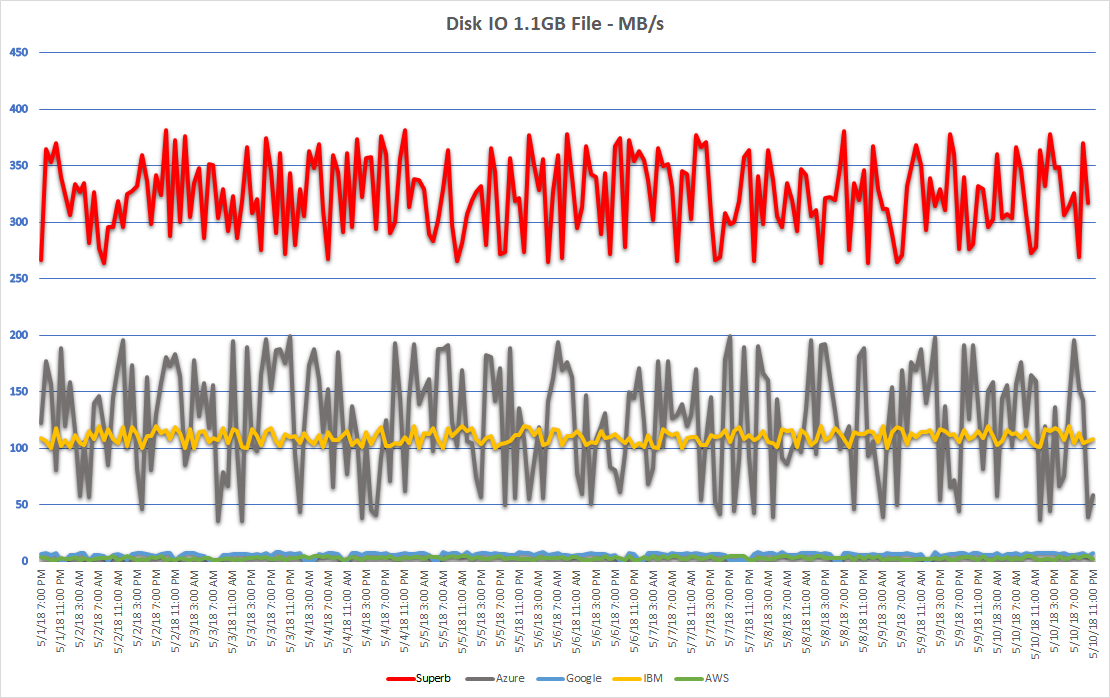
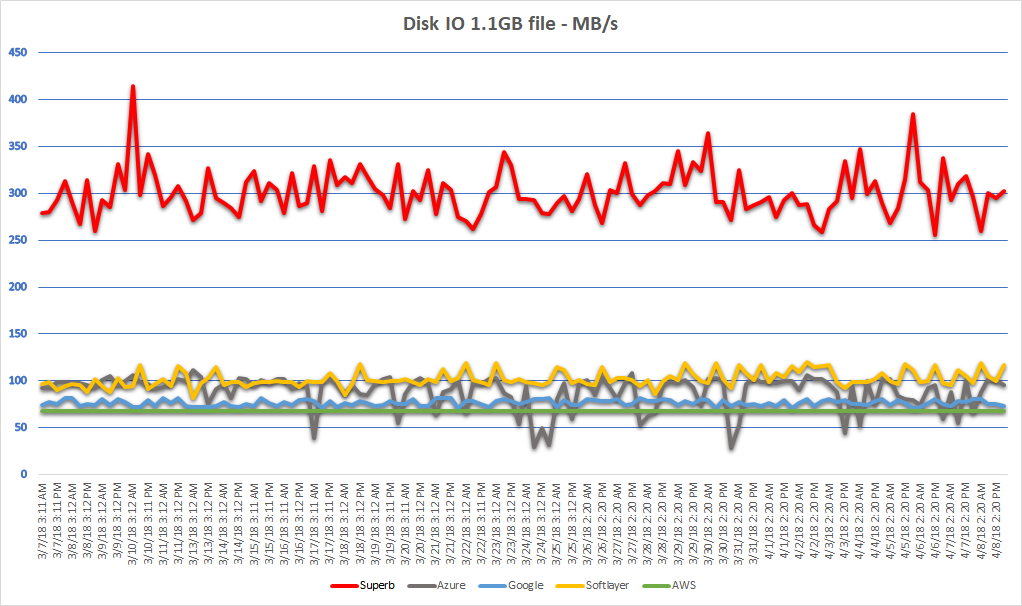
Fig. 1 - Disk IO 1.1GB File - MB/s - Comparison
The Results Speak For Themselves
If you need high-end dedicated server level local SSD disk I/O performance (for example, you are running a database, a mail server, a web server, an application server or otherwise have any other use which frequently reads or writes data, as opposed to stores it in and retrieves it from RAM), your choice is a dedicated server (foregoing the High Availability/100% uptime and next to infinite, instant scalability and numerous self-service advantages of the cloud) or a cloud account with us; other CHPs fall many folds below the par when it comes to disk I/O.
Why the performance variance on the red line? Our block-level Distributed Storage technology will use local (on the currently active hypervisor for VM) data blocks whenever optimal – that is the top level that you see; the bottom level in the red line is when the redundant data blocks on another hypervisor, separate from the active one currently doing the computing of the VM, are used. Notice the slight (less than 30%) variance in performance local disk vs. remote disk? That is the InfiniBand® ultra high performance networking technology at work – which, among other things, is completely packet loss and jitter free and has many 10s of fold lower latency than even the lowest theoretical minimums of 10 Gigabit Ethernet. (With others using conventional SANs, the performance loss is 60%, 80% or more, as you can clearly see in the graphs above. Even at our lowest performance, we more than two fold outperform the competition.)
BYTE UNIX Benchmarks
UnixBench was created in 1983 and to this day is still being used as a core benchmarking methodology by many. We don’t need to worry about all those fancy programming languages used today, we only want to make sure that the performance is there to enable all those fancy programming languages our customers use to be at their best and deliver the fastest results; that is where the standardized UnixBench tests come in. We like UnixBench as a benchmarking test because it’s the same test your Grandfather would have used to test his 386 machine back in the day – reliable, tried, tested and true. Simply put, the UnixBench test lets you how much “horsepower” your cloud VM has: a well-recognized standard performance indicator.
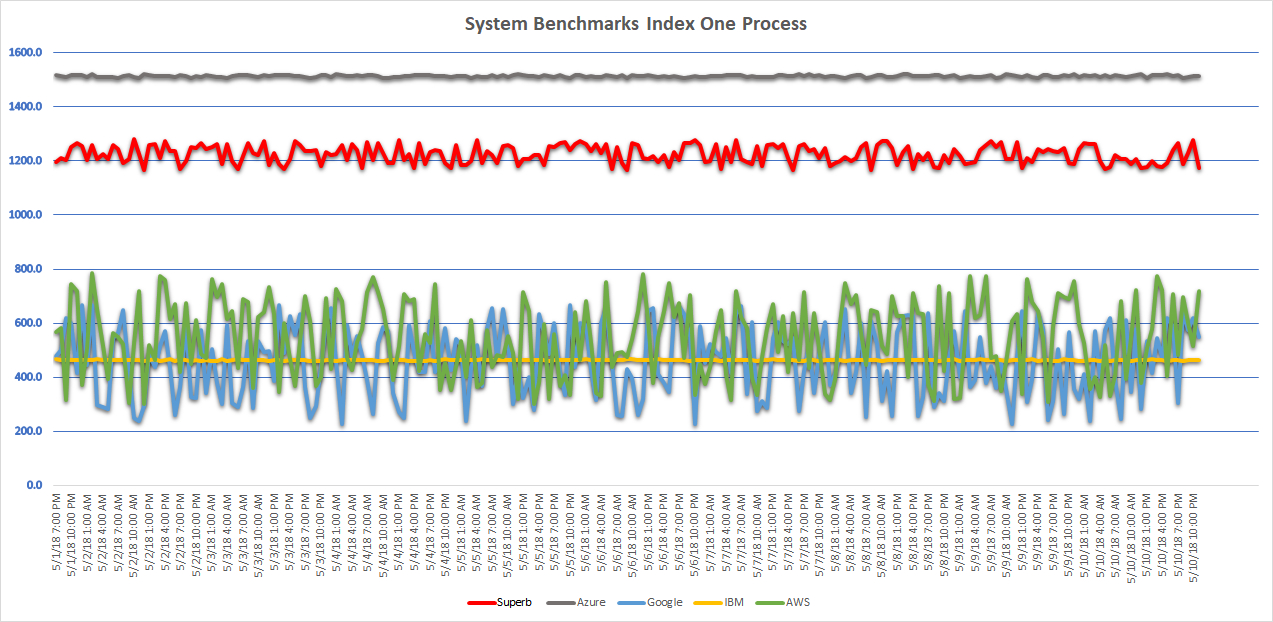
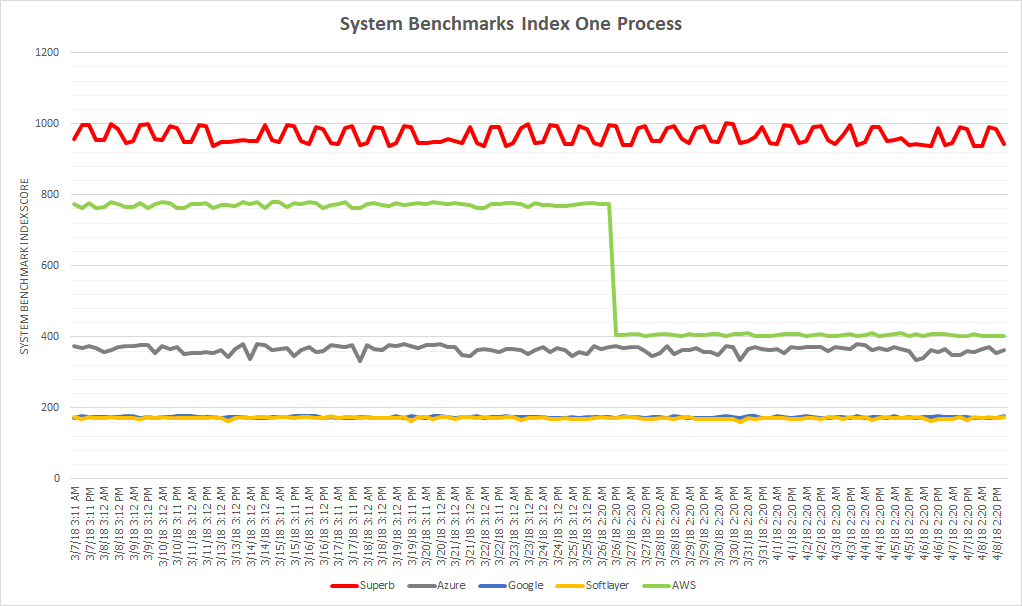
Fig. 2 - One Parallel Process Test Results - Comparison
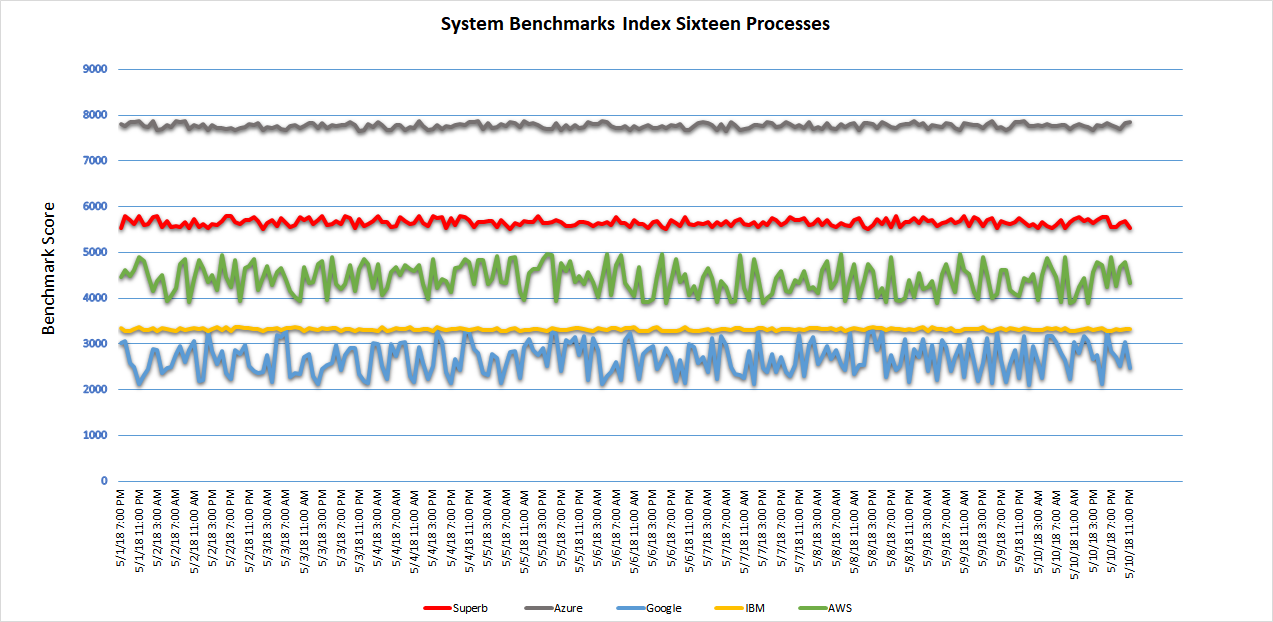
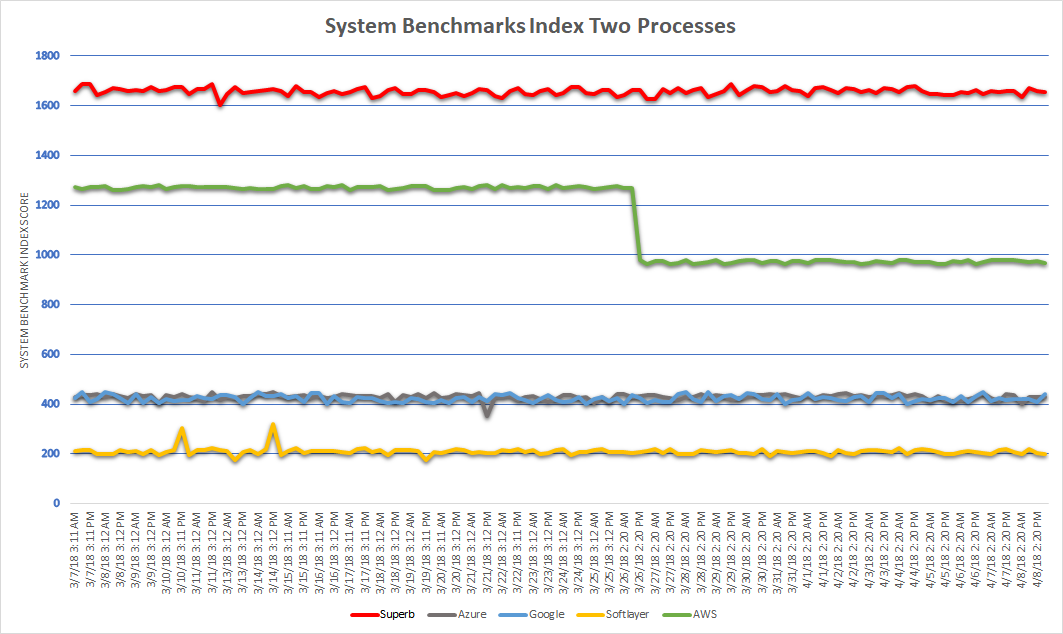
Fig. 3 - Sixteen Parallel Processes Test Results - Comparison
(So there’s no confusion, all tests were run with the default options.)
The UnixBench tests show that our DC2S-2188 account has considerably more dedicated and unshared “horsepower” allocated and available, at all times, than others’ comparable “specs on paper” cloud accounts, except for Azure (however, that is prior to adjusting for 16 cores Azure vs. 14 cores DC2S-2188, and without adjusting for the over 7 fold real-world cost difference). Put in other words, to get performance equivalent to our DC2S-2188 14-core cloud account, you would need to buy two or more of AWS c4.4xlarge 16-core accounts; that is, 32 cores at AWS are equivalent to 14 cores with us, and to get comparable performance and inclusions of our $275/month account, you would need to pay $1164-3306/month with AWS (about 10 times more). What does this show? The higher grade of our underlying hardware, more thorough performance optimization and acceleration in the ThunderCloud platform, and most important of all, the difference that dedicated resources (with us) vs. oversold resources (with others) makes.
What about the white line that is higher than our DC2S-2188 account? That is the Azure F16 account, which edged ahead thanks to the apples-to-oranges comparison: the F16 account has 32GB of RAM and 16 cores, while our DC2S-2188 has 16GB and 14 cores (in our attempt to make the competition look better – given the typical stark difference in performance, we purposefully took a smaller ThunderCloud account to compare with others’ bigger accounts). The F16 also costs more than double ($496/m) without Internet access or $1988 (about 7 times more) with 10TB/m comparable to our DC2S-2188 account (which is $275/m). In other words, even with no Internet connectivity, two DC2S-2188 accounts from Superb would not only still cost less than one Azure F16, but also outperform 1.7+ fold, while with comparable traffic levels (Internet access) included, the difference is even more stark: $550 and 1.7+ higher performance with us vs $1998 with Azure. Lesson learned? Not all cloud accounts are created equal; in fact, the performance difference can be staggering. The headline specs are of little meaning. It is the actual performance (which is never disclosed by the vast majority of CHPs) that must be measured and compared side-by-side, in order to determine an accurate “like for like” performance comparison cloud account sizing.
Lesson learned? Not all cloud accounts are created equal; in fact, the performance difference can be staggering. The headline specs are of little meaning. It is the actual performance (which is never disclosed by the vast majority of CHPs) that must be measured and compared side-by-side, in order to determine an accurate “like for like” performance comparison cloud account sizing.
Our hats off to Azure: while Azure is still a several fold pricier option for the same performance level, Azure does, indeed, at this time have the highest per-core performance of any tested CHP (though it comes at a significant premium of over 5 fold higher cost for similar performance and included traffic with us). Azure beats us on the absolute per-core performance, but we come out several fold ahead in terms of overall performance and value (cost:performance). It is worth noting how big is the difference between different CHPs: more than 3 fold, for what is represented as the same thing (core), though it’s clearly not.
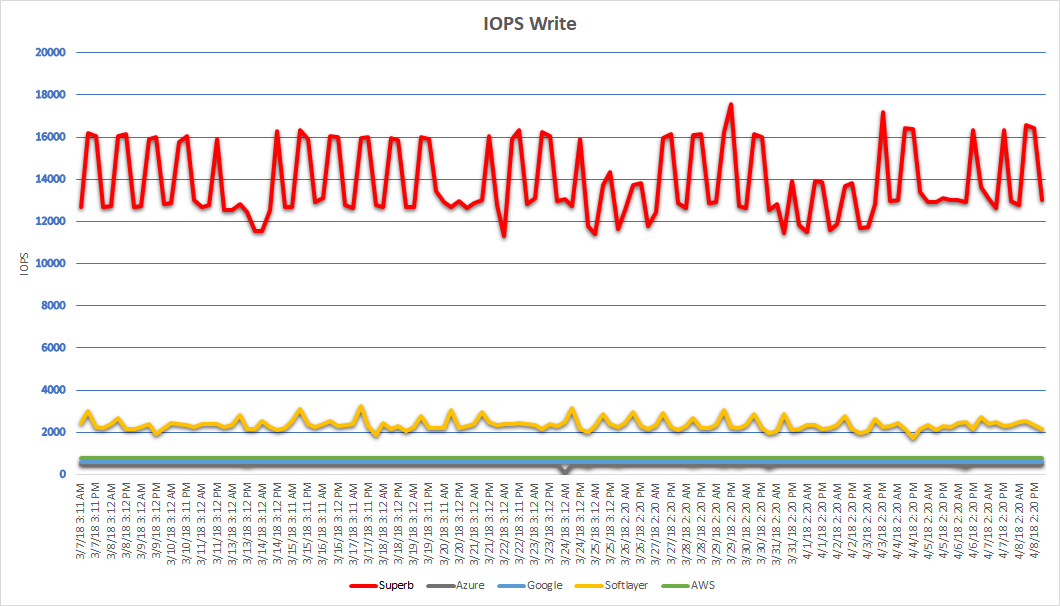
IOPS
Let’s talk IOPS.
We want to make sure that all of our customers always get all the resources they pay for. We don’t oversell, we don’t put all of your eggs (data) in one basket (on one central filer), we make sure your services (E-mail, web sites, databases, applications, and all else that you run) are served fast and efficiently.
If you play any online multiplayer shooter or action games, you know about ping times and you know how inconsistent ping times (jitter) create ‘lag kills’. IOPS is to disk latency what network latency is to ping times. Like a good game of “Call of Duty” or “Fortnite”, good IOPS is about consistency and not a roller coaster.
Input/output operations per second (IOPS, pronounced eye-ops) is an input/output performance measurement used to characterize computer storage devices like hard disk drives (HDD), solid state drives (SSD), and storage area networks (SAN). We use real metrics, real world data. We ran the test with the simple command:
ioping -RD /
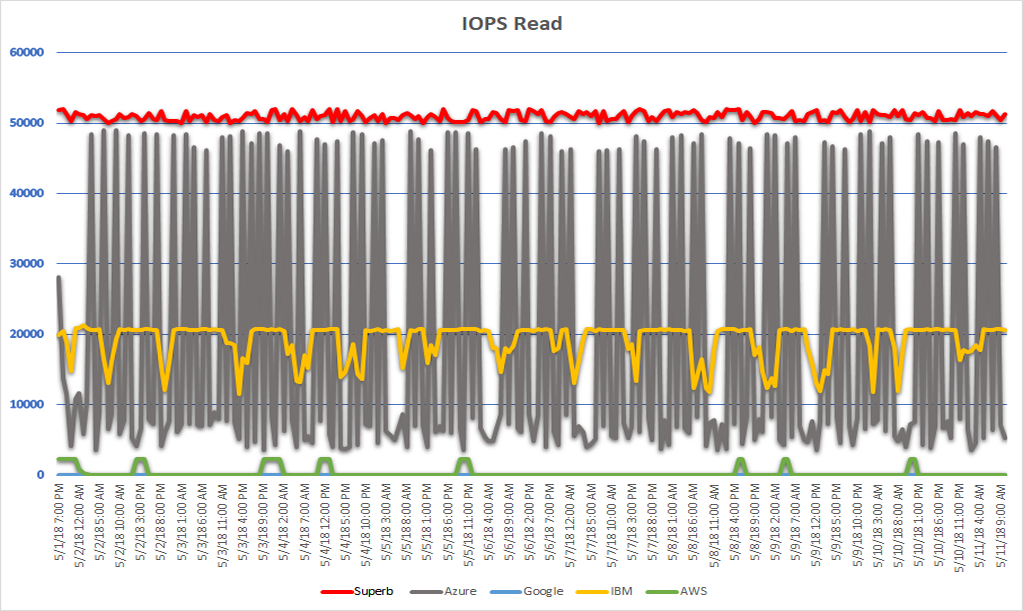
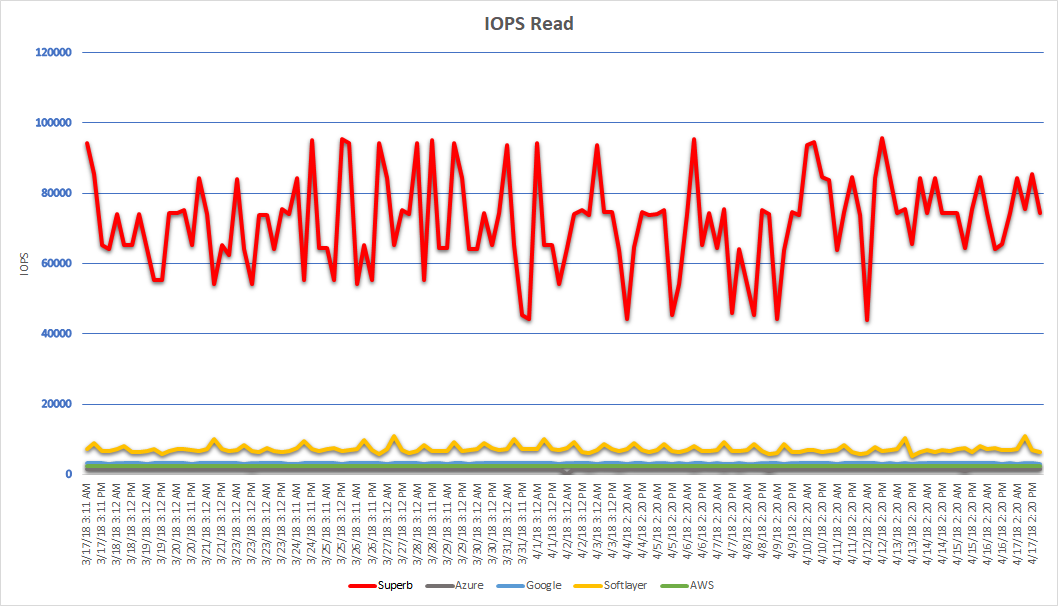
Fig. 4 - IOPS Read Results - Comparison
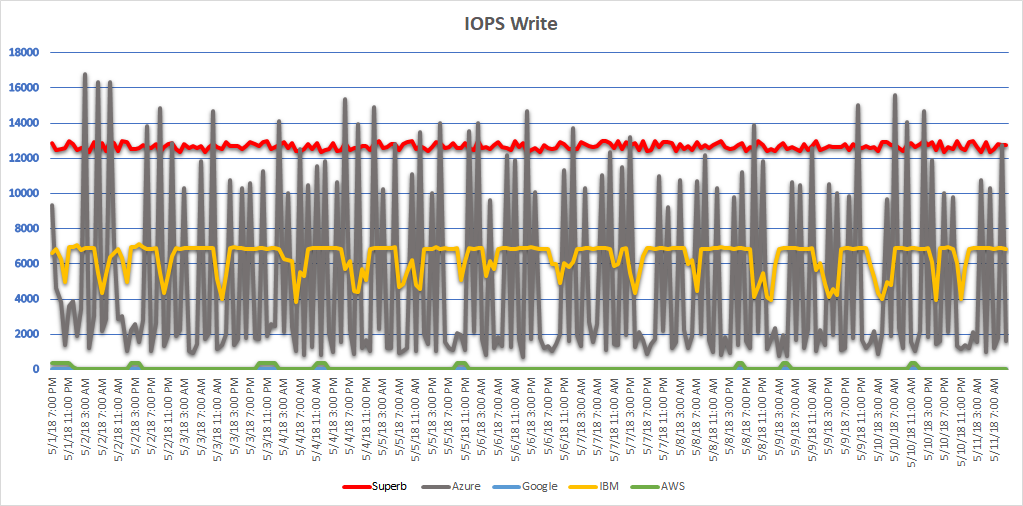
Fig. 5 - IOPS Write Results - Comparison
Our IOPS performance is the highest, and it is consistently consistent (yes, “double consistent”) – so you always know what you are going to get: there are no surprises. With Azure the IOPS, only a small a fraction of our performance, varies greatly, thus giving you highly variable and unpredictable roller coaster-like performance (the “noisy neighbor” effect common in oversold clouds), with IBM it is at about half of our IOPS for write and about 1/7th of our IOPS for write with a clear ceiling (maximum performance limitation), but with frequent drops (again the “noisy neighbor” effect, but less dramatic than Azure), while with AWS and Google it is consistently low, with only a few slight upward spikes.
In short, this means that while with us you can easily architect a cloud hosting solution, comprised of one or multiple VMs, with a consistent and easily forecastable performance (thus delivering a consistent and predictable user experience), using other CHPs cloud it is practically impossible to design for a consistent and predictable user experience (performance), given the significant variations in the IOPS, due to the inherently oversold platform where your “neighbors” use of their cloud VMs can greatly impact your performance and thus your user/customer experience.
In other words, if you are running databases, mail servers, a SaaS platform, or other heavy read/write applications, the cloud you host on it will make a massive difference to the performance and thus your users’ experience. Only on the Superb Cloud are you able to run it with predictable, consistent, and not to mention by far the industry’s highest, IOPS levels, exceeding the competition IOPS by a factor of 2 to 7 fold.
Closing
At Superb Internet, we love what we do, we do it better, and we have been doing it longer, than anyone else. Which is why when we say “we get it” – we really get it. After all, we have many more years’ experience with virtualized/cloud hosting than any other CHP. Our “Ahead of the Rest”® standard has always remained unwavering: we never lower the bar and hold ourselves to a consistently high standard, as we believe in either providing the very best to our customers, or in not providing the service at all – there are no compromises when it comes to service quality and performance.
Instead of going along with the others’ highly obfuscated and greatly oversold ways, we strongly believe in the TransparentCloud™: in providing a consistent and always predictable performance, non-oversold cloud to our clients. That not only makes it much easier for our clients to design their cloud hosted applications, it also delivers a consistently predictable user/customer experience – a key requirement for most commercial cloud deployments. The second generation ThunderCloud™ takes it further by using the newest hardware, adding even more layers of underlying platform optimization & acceleration, moving to 100% Solid State Storage technology basis, and adding the largest vertical (VM size) scalability, on top of the already practically limitless horizontal scalability.
The examples above have illustrated that, depending on what performance metric you use (each client application is unique and thus the most important performance value will differ from client to client), to get performance equivalent to our comparable specs cloud account, you may need to spend as much as 56 times more at AWS. It is not only the various hidden fees at other CHPs that may get you (and end up unexpectedly costing you considerably more than budgeted), but so will the other CHPs unpredictable and highly variable cloud performance. If you take away nothing else from this major CHPs comparative study, just remember this:
- Not all clouds are created equal;
- The published specs have little relation on the real-world performance; therefore, you cannot compare CHPs based on the published specs alone (there is a reason why the real-world performance is rarely if ever talked about in the CHP circles);
- Always – always – run tests for your specific applications/use when comparing multiple CHPs, in order to arrive at the quantity and/or size of accounts to compare at different CHPs which provide for equal performance (as opposed to equal or roughly similar “headline specs”).
We live, work, and play in the real world and we’ve made it simple for you. Unlike others’ obfuscated cloud (where you have no visibility inside it), our cloud is the TransparentCloud™ there are no surprises - you always know what you will get, as we strongly believe in full disclosure (transparency) and are committed to no overselling – so with each cloud account you get the same as at least two like configuration dedicated servers set-up in an HA (High Availability) cluster with two redundant load balancers and real-time data replication (all that you get with each and every cloud VM, where just like with a dedicated server pair, your performance is guaranteed, dedicated and consistent).
Simply put, with us you get the latest modern Distributed Storage and InfiniBand® ultra-high performance networking technology working for you, non-oversold and guaranteed fastest computing power, and “no surprises, no hidden fees” simple, budget-friendly pricing, saving you potentially over 50 fold (yes, over fifty times) over other competing CHPs for similar performance cloud. In short, with our specs you get several fold higher performance, along with several fold lower price, than with seemingly alike cloud accounts at other CHPs.
The reason for this is simple: we are in this for the long term. Most of our customers have been with us for many years, with a high number of customers who’ve been with us for over a decade (including an impressive group of clients who’ve been with us, by now, for more than two decades – where we’ve witnessed their exponential growth and their highs and lows, just as they have witnessed and experienced the same with us). We strongly believe in “once a Superb customer, a Superb customer for life.” We base our service specifications, pricing, service quality and delivery, support, and all else on building a life-long business relationship with each and every client. Transparency and consistency is at the core of it. Our goal is not to manipulate our service in a way as to gain the most customers, but to design, build and deliver it in a way as to retain and help each and every customer grow, leaving no doubt as to the performance or cost consistency. When you are our customer, you are not just a customer: you are our partner, and we are your partner in your business success.